DATA STRUCTURE AND EXPLORATION
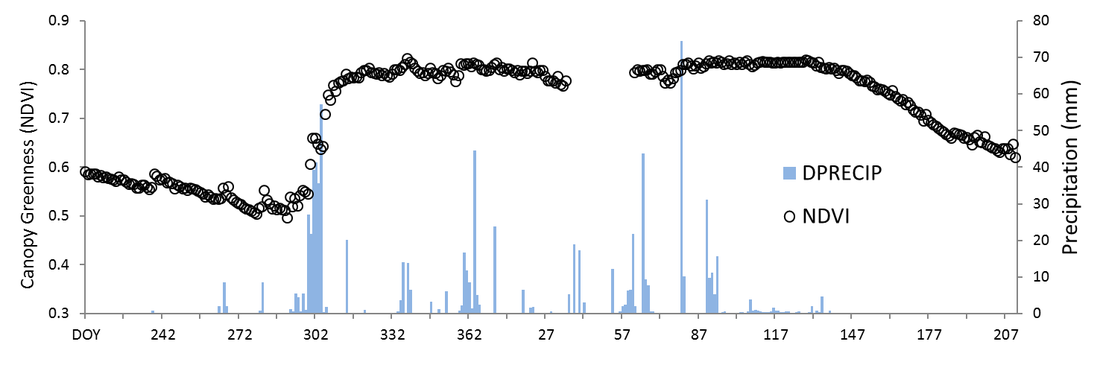
Figure DE1: Time-series of tropical dry forest canopy greenness index with precipitation: at the Brazilian study plot we can see the normalized difference vegetative index (NDVI) reaches its minimum of around 0.50 in September and October (DOY 290) when no leaves are present in the canopy, and quickly reaches its maximum greenness value around 0.82 in November (DOY 320) after the onset of the first rainfall. The transition into the growing season can be quite dramatic causing changes in air temperature, relative humidity, and soil moisture. The relationship between such meteorological variables and canopy greenness trends towards the end of the growing season is poorly understood compared to during leaf flush.
TIME SERIES OF ALL VARIABLES OF INTEREST FOR BOTH MONITORING SITES

Figure DE2: Time Series of Canopy Greenness (NDVI) and Several Meteorological Variables at Mexican and Brazilian Tropical Dry Forest Sites. Canopy greenness is on the primary y-axis for each site, soil moisture (%), air temperature (°C), relative humidity (%), and vapor pressure deficit (kPa) are on the secondary y-axis. We see that canopy greenness increases begin at day 180 in mexico (top) and at day 300 in brazil (bottom). A small gap occurs in the mid-season NDVI time series for brazil, these data were excluded for the analysis. The meteorological variables show significantly greater stability over time at the mexican site compared to the brazilian site.
TABLE 1: Example showing the structure of the data table set-up for multi-variate analysis on a single site. (Abbreviations described below)

TABLE 1 VARIABLES
DOY = day of year (1 to 365)
PHENO = phenophase (1 to 4)
NDVI = the normalized difference vegetation index
(averaged for mid-day hours 10:00 to 14:00 during indirect lighting conditions, scale 0 to 1)
DAT = daily average air temperature (°C)
DAH = daily average relative humidity (0 to 100%)
VPD = daily average vapor pressure deficit (>0 hPa)
DASM = daily average soil moisture content (m3 H20/m3 soil)
* Daily averages include measurements from sun-rise to sunset (when sunlight > 5 W/m2)
STATISTICAL ANALYSES
Statistical tools in R software package will be utilized for data analysis.
Multiple scatterplots will be made for exploring the relationship between canopy phenophase greenness and meteorological variables. High Data-to-Ink plots will include multiple sites and variables. The main graphic packages from R CRAN used were ggplot2 and lattice.
General linear models are made for the investigation of phenophase 3 to look closer at the mature leaf canopy-climate interactions
DATA APPENDIX: Exploratory Graphics
Site Meteorology Boxplots

Figure DA1: Daily Average Microclimate by Forest Monitoring Site for the Full Observational Year.
DAT = Daily Average Temperature (°C) ; DAH = Daily Average Humidity (%); VPD = Daily Average Vapour Pressure Deficit (kPa) ; DASM = Daily Average Soil Moisture (ratio of water to soil).
DAT = Daily Average Temperature (°C) ; DAH = Daily Average Humidity (%); VPD = Daily Average Vapour Pressure Deficit (kPa) ; DASM = Daily Average Soil Moisture (ratio of water to soil).
Chamela Coastal Tropical Dry Forest, Mexico

Mexico site meteorology and phenology data for the full year of data with scatterplot pairs and frequency histograms for each variable: NDVI = Normalized Difference Vegetative Index; DAT = Daily Average Temperature (°C) ; DAH = Daily Average Humidity (%); VPD = Daily Average Vapour Pressure Deficit (kPa) ; DASM = Daily Average Soil Moisture (ratio of water to soil).
Mata Seca Continental Tropical Dry Forest, Brazil.

Brazil site meteorology and phenology data for the full monitoring year with scatterplot pairs and frequency histograms for each variable: NDVI = Normalized Difference Vegetative Index; DAT = Daily Average Temperature (°C) ; DAH = Daily Average Humidity (%); VPD = Daily Average Vapour Pressure Deficit (kPa) ; DASM = Daily Average Soil Moisture (ratio of water to soil)
