MONITORING TROPICAL DRY FORESTS IN-SITU
Study Sites

Figure M1: TDF Monitoring Sites in Brazil, Mata Seca State Park.
Tropical Dry Forests environments are classified by the Holdridge Lifezone as having an average annual rainfall between 250-2000 mm, average temperature greater than 17°C, and where the potential evapotranspiration exceeds the rate of precipitation. Two sites in the Tropi-Dry Research Network are used in this study, the Chamela-Cuixmala Biosphere Reserve in Mexico (19°30.50 N, 105°2.20 W) and the Parque Estadual da Mata Seca in Brazil (14°50.93 S, 43°58.35 W). The Mexican site, Chamela, is a 130,000 ha coastal tropical dry forest adjacent to the pacific ocean with a hilly topography, a rainy season from June to October and an annual precipitation mean of 750 mm. The Brazilian site, Mata Seca (right), is a 14,000 ha continental tropical dry forest in the Rio Sao Francisco river valley with a rainy season from November to April and mean annual precipitation of 870 mm. These two sites lose >90% of the canopy leaves in the dry season as a drought tolerance strategy, and demonstrate rapid leaf flushing with the onset of the rainy season. Study plots are chosen to be remote protected areas far from human disturbances to preserve ecological integrity.
Wireless Sensor Networks for Micro-Meteorology
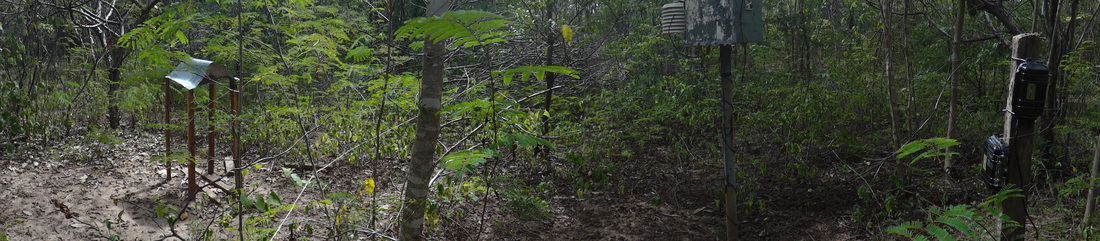
Surface meteorological conditions vary dramatically across relatively small spatial scales in forested environments due to topographical and structural heterogeneity making micrometeorological measurements subject to largely unavoidable sampling biases. This variability needs to be characterized in order to better understand how the sum of small scale micrometeorological processes dictate local weather patterns (Baldocchi and Meyers, 1998). Recent and ongoing technological advances in sensor instrumentation have provided Earth science researchers with new methods for increasing the spatial and temporal accuracy of in-situ observations which are critical to proper biometeorology monitoring and modelling initiatives. As electrical component size and power consumption demands decrease, wireless sensor network (WSN) technology becomes more efficient and effective for large-scale ecological monitoring studies (Romer and Mattern, 2004). Here I exploit the novel application of in-situ WSNs, designed for the University of Alberta’s Center for Earth Observation Science for Tropical Dry Forest environmental monitoring. By using arrays of sensor networks with synchronized sensor sampling across the network, both the spatial and temporal variability of understory abiotic conditions can be more accurately measured. WSNs are equipped with temperature, relative humidity, soil moisture, solar radiation, and photosynthetic radiation sensors sampling every 15 minutes.

Figure M2: An understory wireless sensor network for distributed area monitoring of tropical dry forest temperature, relative humidity, and soil moisture. Multiple synchronized sensors reduce the spatial sampling bias commonly incurred with meteorological monitoring stations.
Measuring Canopy Greenness In-Situ

The most commonly used metric for monitoring landscape scale vegetative health and seasonal dynamics is the Normalized Difference Vegetative Index (NDVI) which essentially describes a greenness value from 0 to 1 based on plant canopy reflectance of visible (400-700nm) and near infrared radiation (700 to 1100nm), where 0 is bare ground and 1 is dense leafy matter. This is commonly produced from earth observation satellite data but such products suffer from atmospheric interference and a lack of validation in tropical dry forests. Wilson and Meyers (2007) described a method for obtaining this greenness parameter from net fluxes of solar and photosynthetically active radiation (PAR) above a plant canopy using common meteorological sensors. The NDVI is very useful in monitoring near surface forest phenology without the limitations of atmospheric interference and other signal to noise ratio constraints present in space borne remote sensing data sets while providing hourly or daily information on canopy health and phenological states. NDVI is however subject to changes in reflection due to the solar zenith angle and lighting conditions.
Employing multiple meteorological sensors for quantifying radiation fluxes above a plant canopy (below), NDVI and EVI2 time series will be derived in-situ for the study plots using above canopy tower sensor platforms called phenology towers (left). Solar radiation and PAR data will be filtered for time of day and illumination thresholds in order retrieve vegetative indices for midday (10:00 to 14:00) direct sunlight conditions to avoid sampling at high zenith angles and during cloudy periods when spectral reflectance is less indicative of canopy status (Huemmrich et al, 1999; Nagai et al., 2010).
Employing multiple meteorological sensors for quantifying radiation fluxes above a plant canopy (below), NDVI and EVI2 time series will be derived in-situ for the study plots using above canopy tower sensor platforms called phenology towers (left). Solar radiation and PAR data will be filtered for time of day and illumination thresholds in order retrieve vegetative indices for midday (10:00 to 14:00) direct sunlight conditions to avoid sampling at high zenith angles and during cloudy periods when spectral reflectance is less indicative of canopy status (Huemmrich et al, 1999; Nagai et al., 2010).
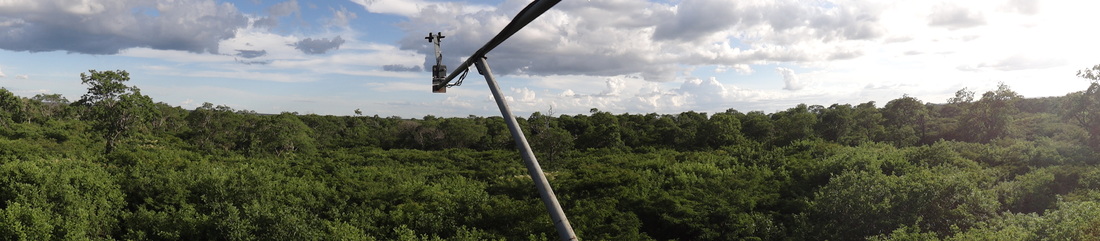
NDVI monitoring system composed of meteorological sensors measuring incoming and reflected solar radiation and photosynthetically active radiation.
Mata Seca State Park, Brazil.
Relating Meteorological Observations to the Four Phenophases of Deciduous Vegetation

Figure M3: Plant canopy time-series is sub-divided into four periods called phenophases based on the greenness pattern: 1) Dormancy, when leaves are absent, 2) Leaf Flush, or green-up, when leaves begin to emerge and expand, 3) Maturity, when leaf expression stabilizes for the majority of the growing season, and 4) Senescence, when photosynthetic activity slows down and leaf abscission occurs. The phenophases are segregated based on greenness trend transitions as described by the day of year where the rate of change in greenness is greatest.
At both monitoring sites the daily aggregated observations of canopy greenness and meteorological measurements as averaged across the in-situ sensor networks will be grouped into phenophases. This phenophase distinction will be used to separate the analysis between canopy greenness and meteorological (met) variables. This is important since the day to day variability in atmospheric temperature and humidity may be greater than what we see in seasonal change sin canopy greenness. In order to isolate the effects of the met variables to a specific stage of canopy leaf expression the data must be segregated based on the phenophase.
At both monitoring sites the daily aggregated observations of canopy greenness and meteorological measurements as averaged across the in-situ sensor networks will be grouped into phenophases. This phenophase distinction will be used to separate the analysis between canopy greenness and meteorological (met) variables. This is important since the day to day variability in atmospheric temperature and humidity may be greater than what we see in seasonal change sin canopy greenness. In order to isolate the effects of the met variables to a specific stage of canopy leaf expression the data must be segregated based on the phenophase.
REFERENCES
Baldocchi, D and T. Meyers. 1998. On using eco-physiological, micrometeorological and biogeochemical theory to evaluate carbon dioxide, water vapor and trace gas fluxes over vegetation: a perspective. Agricultural and Forest Meteorology, 90: 1-25.
Huemmrich, K. F., T. A. Black, P. G. Jarvis, J. H. McCaughey, and F. G. Hall 1999. High temporal resolution NDVI phenology from micrometeorological radiation sensors, Journal of Geophysical Research, 104: 935–944
Jiang, Z., A.R. Huete, K. Didan, and T. Miura. 2008. Development of a two-band enhanced vegetation index without a blue band. Remote Sensing of Environment, 112: 3833-3845.
Nagai, S., K.N Nasahara, H. Muraoka, T. Akiyama, & S. Tsuchida. 2010. Field experiments to test the use of the normalized-difference vegetation index for phenology detection. Agricultural and Forest Meteorology, 150: 152-160.
Römer, K., F. Mattern. 2004. "The Design Space of Wireless Sensor Networks". IEEE Wireless Communications, 11: 54-61.
Wilson, T.B. and T.P. Meyers. 2007. Determining vegetation indices from solar and photosynthetically active radiation fluxes. Agricultural and Forest Meteorology, 144: 160-179.
